|
|
PRESENTING YOUR RESEARCHAfter you have finished doing your mathematics research, you will need to present your findings to others. There are three main ways to do this:
The following sections provide information about each of these presentation strategies. Writing Up Your ResearchYour project write-up is a chance to synthesize what you have learned about your mathematics research problem and to share it with others. Most people find that when they complete their write-up it gives them quite a bit of satisfaction. The process of writing up research forces you to clarify your own thinking and to make sure you really have rigorous arguments. You may be surprised to discover how much more you will learn by summarizing your research experience! If you have ever looked at a mathematics journal to see how mathematicians write up new results, you may have found that everything seemed neat and polished. The author often poses a question and then presents a proof that leads neatly, and sometimes elegantly, to his or her solution. Mathematicians rarely talk about the dead ends they met along the way in these formal presentations. Your write-up will be different. We hope that you will tell your reader about your thought process. How did you start? What did you discover? Where did that lead you? What were your conjectures? Did you disprove any of them? How did you prove the ones that were true? By answering these questions, you will provide a detailed map that will take the reader through your research experience. This guide will give you a brief overview of the parts of a mathematics research paper. Following the guide is a sample write up so you can see how one person wrote about her research experience and shared her results. A formal mathematics research paper includes a number of sections. These will be appropriate for your write-up as well. The sections of the report are linked so that you can see an example of each part in the sample write-up that follows. Note that not all mathematical research reports contain all of the sections. For example, you might not have any appendices to include or you may not do a literature review. However, your write-up should definitely contain parts 1, 2, 4, 5, 6 and 7. As with any paper you write, a title is important. It should catch the attention of the reader as well as reflect the content of your paper. An abstract is a summary paragraph in which you explain the basic purpose of your paper, state the question(s) you answered, and tell the reader what you proved. It provides an outline of your paper so that someone who might be interested in your paper will know what he or she will learn by reading it. Usually people write their abstract after they have finished writing the body of the report because it summarizes what they wrote, not what they plan to write. If you did research about your topic by consulting existing literature and then built upon what you learned by extending the ideas, then it is appropriate to include a literature review in your paper. This section should read as an analytical essay and tell your reader about the state of the art in your research area. Provide the reader with the background and the context of your topic, demonstrating your expertise in the process. It is appropriate to identify and discuss books, articles and other source materials that you read for your project. Everything in your literature review should be mentioned in your reference section, but not everything in your reference section belongs in your literature review. You are merely commenting on the most valuable material you have identified that you will need to assimilate for your project. This section should be rich in footnotes or parenthetical references to original sources. In the literature review section you may answer questions such as “What kind of research has been done before?” “What kind of relevant studies or techniques needed to be mastered to do your project?” “How have others gone about trying to solve your problem, and how does your approach differ?” 4. Statement of the Problem/Introduction [see sample] Here you “set the stage” for your paper. A brief introduction should give the reader some understanding of the context in which you are working. What was the source of inspiration for your problem? Is it a modification of some other question? Why is this problem important or interesting to you (or someone else?) Be sure to state the question or questions that you will examine in your report. You don’t want to do any proving here, just tell the reader what questions you plan to discuss in your paper. 5. Body of the Report [see sample] Take the reader on a trip through your research project. Using your log book as your guide, start with your initial explorations and conjectures. Explain any definitions and notation that you developed. Tell the reader what you discovered as you learned more about the problem. Provide any numeric, geometric or symbolic examples that guided you toward your conjectures. Show your results. Explain how you proved your conjectures. The body of your report should be a mix of English narrative and more abstract representations. Be sure to include lots of examples to help your reader understand your reasoning. If your paper is very long, you can divide the body of your report into sections so that it easier to tackle the various aspects of your work. 6. Ideas for Further Research [see sample] As you worked on your research project, questions that you didn’t have time to answer, or that were beyond the scope of what you were doing, undoubtedly surfaced. State those questions here. Maybe you will inspire someone else to tackle those questions. Maybe you will work on them yourself at another time. By posing them here, you participate in advancing the field of mathematics. You place your work within a larger framework of inquiry. As with any research paper, you must give credit to the people whose work you used in writing your report. Include articles and books that you used. It is also appropriate to cite articles and other material that you found on the World Wide Web. There is more than one accepted form for referencing materials; here we provide examples using the APA (American Psychological Association) style. For more complete instructions you may find one of the APA Style guides helpful. Most libraries have a copy.
In the appendices you should include any data or material that supported your research but that was too long to include in the body of your paper. Materials in an appendix should be referenced at some point in the body of the report. Some examples: • If you wrote a computer program to generate more data than you could produce by hand, you should include the code and some sample output. • If you collected statistical data using a survey, include a copy of the survey. • If you have lengthy tables of numbers that you do not want to include in the body of your report, you can put them in an appendix.
Sample Write-Up
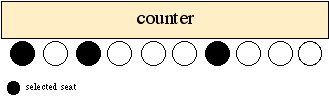
SEATING UNFRIENDLY CUSTOMERSA Combinatorics ProblemBy Lisa Honeyman AbstractThe answers to combinatorial questions concerning unfriendly customers
at a morning coffee shop are found. It is proven that if there are n
seats and c customers who refuse to sit next to each other
at a coffee shop counter, then there are n-c+1Pc
ways for them to sit. It is also proven that if there are n
seats and c customers who refuse to sit next to each other
at a circular table, then there are The ProblemIn a certain coffee shop, the customers are grouchy in the early morning and none of them wishes to sit next to another at the counter. 1. Suppose there are ten seats at the counter. How many different ways can three early morning customers sit at the counter so that no one sits next to anyone else? 2. What if there are n seats at the counter? 3. What if we change the number of customers? 4. What if, instead of a counter, there was a round table and people refused to sit next to each other?
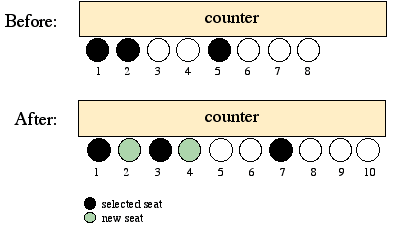
AssumptionsI am assuming that the order in which the people sit matters. So, if three people occupy the first, third and fifth seats, there are actually 6 (3!) different ways they can do this. I will explain more thoroughly in the body of my report. Body of the ReportAt first there are 10 seats available for the 3 people to sit in. But once the first person sits down, that limits where the second person can sit. Not only can’t he sit in the now-occupied seat, he can’t sit next to it either. What confused me at first was that if the first person sat at one of the ends, then there were 8 seats left for the second person to chose from. But if the 1st person sat somewhere else, there were only 7 remaining seats available for the second person. I decided to look for patterns. By starting with a smaller number of seats, I was able to count the possibilities more easily. I was hoping to find a pattern so I could predict how many ways the 10 people could sit without actually trying to count them all. I realized that the smallest number of seats I could have would be 5. Anything less wouldn’t work because people would have to sit next to each other. So, I started with 5 seats. I called the customers A, B, and C. With 5 seats there is only one configuration that works.
As I said in my assumptions section, I thought that the order in which the people sit is important. Maybe one person prefers to sit near the coffee maker or by the door. These would be different, so I decided to take into account the different possible ways these 3 people could occupy the 3 seats shown above. I know that ABC can be arranged in 3! = 6 ways. (ABC, ACB, BAC, BCA, CAB, CBA). So there are 6 ways to arrange 3 people in 5 seats with spaces between them. But, there is only one configuration of seats that can be used. (The 1st, 3rd, and 5th). Next, I tried 6 seats. I used a systematic approach to show that there are 4 possible arrangements of seats. This is how my systematic approach works: Assign person A to the 1st seat. Put person B in the 3rd seat, because he can’t sit next to person A. Now, person C can sit in either the 5th or 6th positions. (see the top two rows in the chart, below.) Next suppose that person B sits in the 4th seat (the next possible one to the right.) That leaves only the 6th seat free for person C. (see row 3, below.) These are all the possible ways for the people to sit if the 1st seat is used. Now put person A in the 2nd seat and person B in the 4th. There is only one place where person C can sit, and that’s in the 6th position. (see row 4, below.) There are no other ways to seat the three people if person A sits in the 2nd seat. So, now we try putting person A in the 3rd seat. If we do that, there are only 4 seats that can be used, but we know that we need at least 5, so there are no more possibilities.
Possible seats 3 people could occupy if there are 6 seats Once again, the order the people sit in could be ABC, BAC, etc. so there are 4 * 6 = 24 ways for the 3 customers to sit in 6 seats with spaces between them. I continued doing this, counting how many different groups of seats could be occupied by the three people using the systematic method I explained. Then I multiplied that number by 6 to account for the possible permutations of people in those seats. I created the following table of what I found.
Next I tried to come up with a formula. I decided to look for a formula using combinations or permutations. Since we are looking at 3 people, I decided to start by seeing what numbers I would get if I used nC3 and nP3. 3C3 = 1 4C3 = 4 5C3 = 10 6C3 = 20 3P3 = 6 4P3 = 24 5P3 = 60 6P3 = 120 Surprisingly enough, these numbers matched the numbers I found in my table. However, the n in nPr and nCr seemed to be two less than the total # of seats I was investigating. Conjecture 1:Given n seats at a lunch counter, there are n-2C3 ways to select the three seats in which the customers will sit such that no customer sits next to another one. There are n-2P3 ways to seat the 3 customers in such a way than none sits next to another. After I found a pattern, I tried to figure out why n-2C3 works. (If the formula worked when order didn’t matter it could be easily extended to when the order did, but the numbers are smaller and easier to work with when looking at combinations rather than permutations.) Proof:In order to prove Conjecture 1 convincingly, I need to show two things: (1) Each n – 2 seat choice leads to a legal n seat configuration. (2) Each n seat choice resulted from a unique n – 2 seat configuration. To prove these two things I will show (3) There is a function, f, such that f(n
– 2 non-separated seats) (4) There is a function, g, such that g(n
separated seats) And then conclude that these two procedures are both functions and therefore 1—1. Claim (1): Each (n – 2)-seat choice leads to a legal n seat configuration. Suppose there were only n – 2 seats to begin with. First we pick three of them in which to put people, without regard to whether or not they sit next to each other. But, in order to guarantee that they don’t end up next to another person, we introduce an empty chair to the right of each of the first two people. It would look like this:
We don’t need a third “new” seat because once the person who is farthest to the right sits down, there are no more customers to seat. So, we started with n – 2 chairs but added two for a total of n chairs. Anyone entering the restaurant after this procedure had been completed wouldn’t know that there had been fewer chairs before these people arrived and would just see three customers sitting at a counter with n chairs. This procedure guarantees that two people will not end up next to each other. Thus, each (n – 2)-seat choice leads to a unique, legal n seat configuration. Using mathematical notation: Suppose s1, s2
and s3 are the locations selected with all three
distinct. That is, s2 s2' = s2 + 1
s3' = s3 + 2
Therefore, positions s1' s2', and s3' are all separated by at least one vacant seat. This is a function that maps each combination of 3 seats selected from n – 2 seats onto a unique arrangement of n seats with 3 separated customers. Therefore, it is invertible. f(n – 2 non-separated seats) Claim (2): Each 10-seat choice has a unique 8-seat configuration. Given a legal 10-seat configuration, each of the two left-most diners must have an open seat to his/her right. Remove it and you get a unique 8-seat arrangement. If, in the 10-seat setting, we have q1 > q2, q3; q3 – 1 > q2, and q2 – 1 > q1, then the 8 seat positions are q1' = q2, q2' = q2 – 1, and q3' = q3 – 2. Combining these equations with the conditions we have q2' = q2 – 1 which implies q2' > q1 = q1' q3' = q3 – 2 which implies q3' > q2 – 1 = q2' Since q3' > q2' > q1', these seats are distinct. If the diners are seated in locations q1, q2, and q3 (where q3 – 1 > q2 and q2 – 1 > q1) and we remove the two seats to the right of q1 and q2, then we can see that the diners came from q1, q2 – 1, and q3 – 2. This is a function that maps a legal 10-seat configuration to a unique 8-seat configuration. g(n separated seats) The size of a set can be abbreviated s( ). I will use the abbreviation S to stand for n separated seats and N to stand for the n – 2 non-separated seats. s(S) and s(N) therefore s(N) = s(S). Because the sets are the same size, these functions are 1—1. Using the technique of taking away and adding empty chairs, I can extend the problem to include any number of customers. For example, if there were 4 customers and 10 seats there would be 7C4 = 35 different combinations of chairs to use and 7P4 = 840 ways for the customers to sit (including the fact that order matters). You can imagine that three of the ten seats would be introduced by three of the customers. So, there would only be 7 to start with. In general, given n seats and c customers, we remove c-1 chairs and select the seats for the c customers. This leads to the formula n-(c-1)Cc = n-c+1Cc for the number of arrangements. Once the number of combinations of seats is found, it is necessary to multiply by c! to find the number of permutations. Looking at the situation of 3 customers and using a little algebraic manipulation, we get the nP3 formula shown below. n-2C3 = If we multiply n-2C3 by 3! we get
This same algebraic manipulation works if you have c people rather than 3, resulting in n-c+1Pc
Answers to Questions
_________________________________________________________________ _ After I finished looking at this question as it applied to people sitting in a row of chairs at a counter, I considered the last question, which asked would happen if there were a round table with people sitting, as before, always with at least one chair between them. I went back to my original idea about each person dragging in an extra chair that she places to her right, barring anyone else from sitting there. There is no end seat, so even the last person needs to bring an extra chair because he might sit to the left of someone who has already been seated. So, if there were 3 people there would be 7 seats for them to choose from and 3 extra chairs that no one would be allowed to sit in. By this reasoning, there would be 7C3 = 35 possible configurations of chairs to choose and 7P3 = 840 ways for 3 unfriendly people to sit at a round table. Conjecture 2: Given 3 customers and n seats there are n-3C3 possible groups of 3 chairs which can be used to seat these customers around a circular table in such a way that no one sits next to anyone else. My first attempt at a proof: To test this conjecture I started by listing the first few numbers generated by my formula: When n = 6 6-3C3 = 3C3 = 1 When n = 7 7-3C3 = 4C3 = 4 When n = 8 8-3C3 = 5C3 = 10 When n = 9 9-3C3 = 6C3 = 20 Then I started to systematically count the first few numbers of groups of possible seats. I got the numbers shown in the following table. The numbers do not agree, so something is wrong — probably my conjecture!
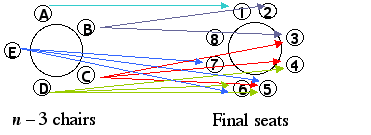
I looked at a circular table with 8 people and tried to figure out the reason this formula doesn’t work. If we remove 3 seats (leaving 5) there are 10 ways to select 3 of the 5 remaining chairs. (5C3). The circular table at the left in the figure below shows the n – 3 (in this case 5) possible chairs from which 3 will be randomly chosen. The arrows point to where the person who selects that chair could end up. For example, if chair A is selected, that person will definitely end up in seat #1 at the table with 8 seats. If chair B is selected but chair A is not, then seat 2 will end up occupied. However, if chair A and B are selected, then the person who chose chair B will end up in seat 3. The arrows show all the possible seats in which a person who chose a particular chair could end. Notice that it is impossible for seat #8 to be occupied. This is why the formula 5C3 doesn’t work. It does not allow all seats at the table of 8 to be chosen.
The difference is that in the row-of-chairs-at-a-counter problem there is a definite “starting point” and “ending point.” The first chair can be identified as the one farthest to the left, and the last one as the one farthest to the right. These seats are unique because the “starting point” has no seat to the left of it and the “ending point” has no seat to its right. In a circle, it is not so easy. Using finite differences I was able to find a formula that generates the correct numbers: tn =
Conjecture 3: Given 3 customers and n seats
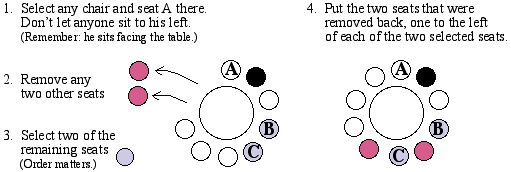
there are Proof: We need to establish a “starting point.” This could be any of the n seats. So, we select one and seat person A in that seat. Person B cannot sit on this person’s left (as he faces the table), so we must eliminate that as a possibility. Also, remove any 2 other chairs, leaving (n – 4) possible seats where the second person can sit. Select another seat and put person B in it. Now, select any other seat from the (n – 5) remaining seats and put person C in that. Finally, take the two seats that were previously removed and put one to the left of B and one to the left of C.
The following diagram should help make this procedure clear.
Finally, if we decide that the order in which the diners sit does not
matter, we can divide the function f(n) = n(n
– 4)(n – 5) by 3! so we don’t count each configuration
6 times. This results in the function: g(n) = In a manner similar to the method I used in the row-of-chairs-at-a-counter problem, this could be proven more rigorously. Consider a grid of chairs in a classroom and a group of 3 very smelly people. No one wants to sit adjacent to anyone else. (There would be 9 empty seats around each person.) Suppose there are 16 chairs in a room with 4 rows and 4 columns. How many different ways could 3 people sit? What if there was a room with n rows and n columns? What if it had n rows and m columns? Abrams, Joshua. Education Development Center, Newton, MA. December 2001 - February 2002. Conversations with my mathematics mentor. Brown, Richard G. 1994. Advanced Mathematics. Evanston, Illinois. McDougal Littell Inc. pp. 578-591 The Oral PresentationGiving an oral presentation about your mathematics research can be very exciting! You have the opportunity to share what you have learned, answer questions about your project, and engage others in the topic you have been studying. After you finish doing your mathematics research, you may have the opportunity to present your work to a group of people such as your classmates, judges at a science fair or other type of contest, or educators at a conference. With some advance preparation, you can give a thoughtful, engaging talk that will leave your audience informed and excited about what you have done. Planning for Your Oral PresentationIn most situations, you will have a time limit of between 10 and 30 minutes in which to give your presentation. Based upon that limit, you must decide what to include in your talk. Come up with some good examples that will keep your audience engaged. Think about what vocabulary, explanations, and proofs are really necessary in order for people to understand your work. It is important to keep the information as simple as possible while accurately representing what you’ve done. It can be difficult for people to understand a lot of technical language or to follow a long proof during a talk. As you begin to plan, you may find it helpful to create an outline of the points you want to include. Then you can decide how best to make those points clear to your audience. You must also consider who your audience is and where the presentation will take place. If you are going to give your presentation to a single judge while standing next to your project display, your presentation will be considerably different than if you are going to speak from the stage in an auditorium full of people! Consider the background of your audience as well. Is this a group of people that knows something about your topic area? Or, do you need to start with some very basic information in order for people to understand your work? If you can tailor your presentation to your audience, it will be much more satisfying for them and for you. No matter where you are presenting your speech and for whom, the structure of your presentation is very important. There is an old bit of advice about public speaking that goes something like this: “Tell em what you’re gonna tell ’em. Tell ’em. Then tell ’em what you told ’em.” If you use this advice, your audience will find it very easy to follow your presentation. Get the attention of the audience and tell them what you are going to talk about, explain your research, and then following it up with a re-cap in the conclusion. Writing Your IntroductionYour introduction sets the stage for your entire presentation. The first 30 seconds of your speech will either capture the attention of your audience or let them know that a short nap is in order. You want to capture their attention. There are many different ways to start your speech. Some people like to tell a joke, some quote famous people, and others tell stories. Here are a few examples of different types of openers. You can use a quote from a famous person that is engaging and relevant to your topic. For example: • Benjamin Disraeli once said, “There are three kinds of lies: lies, damn lies, and statistics.” Even though I am going to show you some statistics this morning, I promise I am not going to lie to you! Instead, . . . • The famous mathematician, Paul Erdös, said, “A Mathematician is a machine for turning coffee into theorems.” Today I’m here to show you a great theorem that I discovered and proved during my mathematics research experience. And yes, I did drink a lot of coffee during the project! • According to Stephen Hawking, “Equations are just the boring part of mathematics.” With all due respect to Dr. Hawking, I am here to convince you that he is wrong. Today I’m going to show you one equation that is not boring at all! Some people like to tell a short story that leads into their discussion. “Last summer I worked at a diner during the breakfast shift. There were 3 regular customers who came in between 6:00 and 6:15 every morning. If I tell you that you didn’t want to talk to these folks before they’ve had their first cup of coffee, you’ll get the idea of what they were like. In fact, these people never sat next to each other. That’s how grouchy they were! Well, their anti-social behavior led me to wonder, how many different ways could these three grouchy customers sit at the breakfast counter without sitting next to each other? Amazingly enough, my summer job serving coffee and eggs to grouchy folks in Boston led me to an interesting combinatorics problem that I am going to talk to you about today.” A short joke related to your topic can be an engaging way to start your speech. It has been said that there are three kinds of mathematicians: those who can count and those who can’t. All joking aside, my mathematics research project involves counting. I have spent the past 8 weeks working on a combinatorics problem.. . . To find quotes to use in introductions and conclusions try: http://www.quotationspage.com/ To find some mathematical quotes, consult the Mathematical Quotation Server: http://math.furman.edu/~mwoodard/mquot.html To find some mathematical jokes, you can look at the “Profession Jokes” web site: http://www.geocities.com/CapeCanaveral/4661/projoke22.htm There is a collection of math jokes compiled by the Canadian Mathematical Society at http://camel.math.ca/Recreation/ After you have the attention of your audience, you must introduce your research more formally. You might start with a statement of the problem that you investigated and what lead you to choose that topic. Then you might say something like this, “Today I will demonstrate how I came to the conclusion that there are n(n – 4)(n – 5) ways to seat 3 people at a circular table with n seats in such a way that no two people sit next to each other. In order to do this I will first explain how I came up with this formula and then I will show you how I proved it works. Finally, I will extend this result to tables with more than 3 people sitting at them.” By providing a brief outline of your talk at the beginning and reminding people where you are in the speech while you are talking, you will be more effective in keeping the attention of your audience. It will also make it much easier for you to remember where you are in your speech as you are giving it. The Middle of Your PresentationBecause you only have a limited amount of time to present your work, you need to plan carefully. Decide what is most important about your project and what you want people to know when you are finished. Outline the steps that people need to follow in order to understand your research and then think carefully about how you will lead them through those steps. It may help to write your entire speech out in advance. Even if you choose not to memorize it and present it word for word, the act of writing will help you clarify your ideas. Some speakers like to display an outline of their talk throughout their entire presentation. That way, the audience always knows where they are in the presentation and the speaker can glance at it to remind him or herself what comes next. An oral presentation must be structured differently than a written one because people can’t go back and “re-read” a complicated section when they are at a talk. You have to be extremely clear so that they can understand what you are saying the first time you say it. There is an acronym that some presenters like to remember as they prepare a talk: “KISS.” It means, “Keep It Simple, Student.” It may sound silly, but it is good advice. Keep your sentences short and try not to use too many complicated words. If you need to use technical language, be sure to define it carefully. If you feel that it is important to present a proof, remember that you need to keep things easy to understand. Rather than going through every step, discuss the main points and the conclusion. If you like, you can write out the entire proof and include it in a handout so that folks who are interested in the details can look at them later. Give lots of examples! Not only will examples make your talk more interesting, but they will also make it much easier for people to follow what you are saying. It is useful to remember that when people have something to look at, it helps to hold their attention and makes it easier for them to understand what you are saying. Therefore, use lots of graphs and other visual materials to support your work. You can do this using posters, overhead transparencies, models, or anything else that helps make your explanations clear. Using MaterialsAs you plan for your presentation, consider what equipment or other materials you might want use. Find out what is available in advance so you don’t spend valuable time creating materials that you will not be able to use. Common equipment used in talks include an over-head projector, VCR, computer, or graphing calculator. Be sure you know how to operate any equipment that you plan to use. On the day of your talk, make sure everything is ready to go (software loaded, tape at the right starting point etc.) so that you don’t have “technical difficulties.” Visual aides can be very useful in a presentation. (See Displaying Your Results for details about poster design.) If you are going to introduce new vocabulary, consider making a poster with the words and their meanings to display throughout your talk. If people forget what a term means while you are speaking, they can refer to the poster you have provided. (You could also write the words and meanings on a black/white board in advance.) If there are important equations that you would like to show, you can present them on an overhead transparency that you prepare prior to the talk. Minimize the amount you write on the board or on an overhead transparency during your presentation. It is not very engaging for the audience to sit watching while you write things down. Prepare all equations and materials in advance. If you don’t want to reveal all of what you have written on your transparency at once, you can cover up sections of your overhead with a piece of paper and slide it down the page as you move along in your talk. If you decide to use overhead transparencies, be sure to make the lettering large enough for your audience to read. It also helps to limit how much you put on your transparencies so they are not cluttered. Lastly, note that you can only project approximately half of a standard 8.5" by 11" page at any one time, so limit your information to displays of that size. Presenters often create handouts to give to members of the audience. Handouts may include more information about the topic than the presenter has time to discuss, allowing listeners to learn more if they are interested. Handouts may also include exercises that you would like audience members to try, copies of complicated diagrams that you will display, and a list of resources where folks might find more information about your topic. Give your audience the handout before you begin to speak so you don’t have to stop in the middle of the talk to distribute it. In a handout you might include: • A proof you would like to share, but you don’t have time to present entirely. • Copies of important overhead transparencies that you use in your talk. • Diagrams that you will display, but which may be too complicated for someone to copy down accurately. • Resources that you think your audience members might find useful if they are interested in learning more about your topic. The ConclusionEnding your speech is also very important. Your conclusion should leave the audience feeling satisfied that the presentation was complete. One effective way to conclude a speech is to review what you presented and then to tie back to your introduction. If you used the Disraeli quote in your introduction, you might end by saying something like, I hope that my presentation today has convinced you that . . . Getting ReadyAfter you have written your speech and prepared your visuals, there is still work to be done.
The DeliveryHow you deliver your speech is almost as important as what you say. If you are enthusiastic about your presentation, it is far more likely that your audience will be engaged. Never apologize for yourself. If you start out by saying that your presentation isn’t very good, why would anyone want to listen to it? Everything about how you present yourself will contribute to how well your presentation is received. Dress professionally. And don’t forget to smile! Here are a few tips about delivery that you might find helpful.
Displaying Your Results When you create a visual display of your work, it is important to capture and retain the attention of your audience. Entice people to come over and look at your work. Once they are there, make them want to stay to learn about what you have to tell them. There are a number of different formats you may use in creating your visual display, but the underlying principle is always the same: your work should be neat, well-organized, informative, and easy to read. It is unlikely that you will be able to present your entire project on a single poster or display board. So, you will need to decide which are the most important parts to include. Don’t try to cram too much onto the poster. If you do, it may look crowded and be hard to read! The display should summarize your most important points and conclusions and allow the reader to come away with a good understanding of what you have done. A good display board will have a catchy title that is easy to read from a distance. Each section of your display should be easily identifiable. You can create posters such as this by using headings and also by separating parts visually. Titles and headings can be carefully hand-lettered or created using a computer. It is very important to include lots of examples on your display. It speeds up people’s understanding and makes your presentation much more effective. The use of diagrams, charts, and graphs also makes your presentation much more interesting to view. Every diagram or chart should be clearly labeled. If you include photographs or drawings, be sure to write captions that explain what the reader is looking at. In order to make your presentation look more appealing, you will probably want to use some color. However, you must be careful that the color does not become distracting. Avoid florescent colors, and avoid using so many different colors that your display looks like a patch-work quilt. You want your presentation to be eye-catching, but you also want it to look professional.
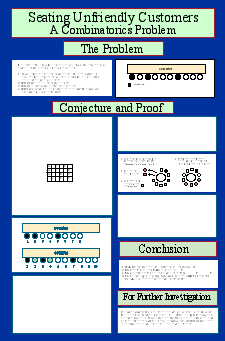
People should be able to read your work easily, so use a reasonably large font for your text. (14 point is a recommended minimum.) Avoid writing in all-capitals because that is much harder to read than regular text. It is also a good idea to limit the number of different fonts you use on your display. Too many different fonts can make your poster look disorganized. Notice how each section on the sample poster is defined by the use of a heading and how the various parts of the presentation are displayed on white rectangles. (Some of the rectangles are blank, but they would also have text or graphics on them in a real presentation.) Section titles were made with pale green paper mounted on red paper to create a boarder. Color was used in the diagrams to make them more eye-catching. This poster would be suitable for hanging on a bulletin board. If you are planning to use a poster, such as this, as a visual aid during an oral presentation, you might consider backing your poster with foam-core board or corrugated cardboard. A strong board will not flop around while you are trying to show it to your audience. You can also stand a stiff board on an easel or the tray of a classroom blackboard or whiteboard so that your hands will be free during your talk. If you use a poster as a display during an oral presentation, you will need to make the text visible for your audience. You can create a hand-out or you can make overhead transparencies of the important parts. If you use overhead transparencies, be sure to use lettering that is large enough to be read at a distance when the text is projected.
If you are preparing your display for a science fair, you will probably want to use a presentation board that can be set up on a table. You can buy a pre-made presentation board at an office supply or art store or you can create one yourself using foam-core board. With a presentation board, you can often use the space created by the sides of the board by placing a copy of your report or other objects that you would like people to be able to look at there. In the illustration, a black trapezoid was cut out of foam-core board and placed on the table to make the entire display look more unified. Although the text is not shown in the various rectangles in this example, you will present your information in spaces such as these. Don’t forget to put your name on your poster or display board. And, don’t forget to carefully proof-read your work. There should be no spelling, grammatical or typing mistakes on your project. If your display is not put together well, it may make people wonder about the quality of the work you did on the rest of your project. For more information about creating posters for science fair competitions, see http://school.discovery.com/sciencefaircentral/scifairstudio/handbook/display.html, http://www.siemens-foundation.org/science/poster_guidelines.htm, Robert Gerver’s book, Writing Math Research Papers, (published by Key Curriculum Press) has an excellent section about doing oral presentations and making posters, complete with many examples. References UsedAmerican Psychological Association. Electronic reference formats recommended by the American Psychological Association. (2000, August 22). Washington, DC: American Psychological Association. Retrieved October 6, 2000, from the World Wide Web: http://www.apastyle.org/elecsource.html Bridgewater State College. (1998, August 5). APA Style: Sample Bibliographic Entries (4th ed). Bridgewater, MA: Clement C. Maxwell Library. Retrieved December 20, 2001, from the World Wide Web:http://www.bridgew.edu/dept/maxwell/apa.htm Crannell, Annalisa. (1994). A Guide to Writing in Mathematics Classes. Franklin & Marshall College. Retrieved January 2, 2002, from the World Wide Web: http://www.fandm.edu/Departments/Mathematics/writing_in_math/guide.html Gerver, Robert. 1997. Writing Math Research Papers. Berkeley, CA: Key Curriculum Press. Moncur, Michael. (1994-2002 ). The Quotations Page. Retrieved April 9, 2002, from the World Wide Web: http://www.quotationspage.com/ Public Speaking -- Be the Best You Can Be. (2002). Landover, Hills, MD: Advanced Public Speaking Institute. Retrieved April 9, 2002, from the World Wide Web: http://www.public-speaking.org/ Recreational Mathematics. (1988) Ottawa, Ontario, Canada: Canadian Mathematical Society. Retrieved April 9, 2002, from the World Wide Web: http://camel.math.ca/Recreation/ Shay, David. (1996). Profession Jokes — Mathematicians. Retrieved April 5, 2001, from the World Wide Web: http://www.geocities.com/CapeCanaveral/4661/projoke22.htm Sieman’s Foundation. (2001). Judging Guidelines — Poster. Retrieved April 9, 2002, from the World Wide Web: http://www.siemens-foundation.org/science/poster_guidelines.htm, VanCleave, Janice. (1997). Science Fair Handbook. Discovery.com. Retrieved April 9, 2002, from the World Wide Web: http://school.discovery.com/sciencefaircentral/scifairstudio/handbook/display.html, Woodward, Mark. (2000). The Mathematical Quotations Server. Furman University. Greenville, SC. Retrieved April 9, 2002, from the World Wide Web: http://math.furman.edu/~mwoodard/mquot.html
|
||||||||||||||||||||||||||||||||||||||||||||||||||||||||||||||||||||||||||||||||||||||||||||||||||||||||
|
Translations of mathematical formulas for web display were created by tex4ht. © Copyright 2003 Education Development Center, Inc. (EDC)
|